
07 Dec How to build a live data transaction report
Data is cheap, insight is priceless, as they say…
Connecting a modern BI app to an open data firehose to build automatically updated visuals can make that transition happen.
The first step in the process is thinking about meaningful questions, so a report can be developed to deliver relevant answers.
With the world’s attention span getting shorter, the analyst will also want to deliver these with a minimal number of charts. This is where the data artisan skills become useful…
Open data sources are everywhere and, in many cases, they come in a format that is not accessible to all potential users (xml, JSON, not just Excel), which means that only patient/ data literate users can interrogate the information and extract meaningful insights.
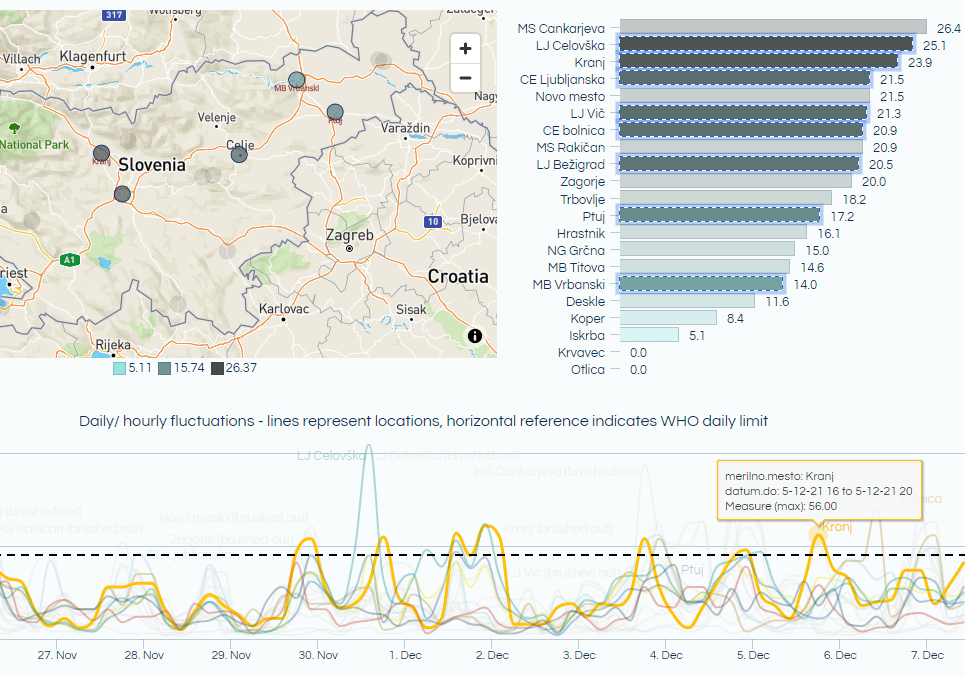
Curious? This tutorial will show you how to build the interactive dashboard presented below. Read more…
Feel free to play with the charts and filters to see the effects!
No Comments