
06 Sep CryptoCurrency Volume / Price correlation analysis – Is there any pattern?
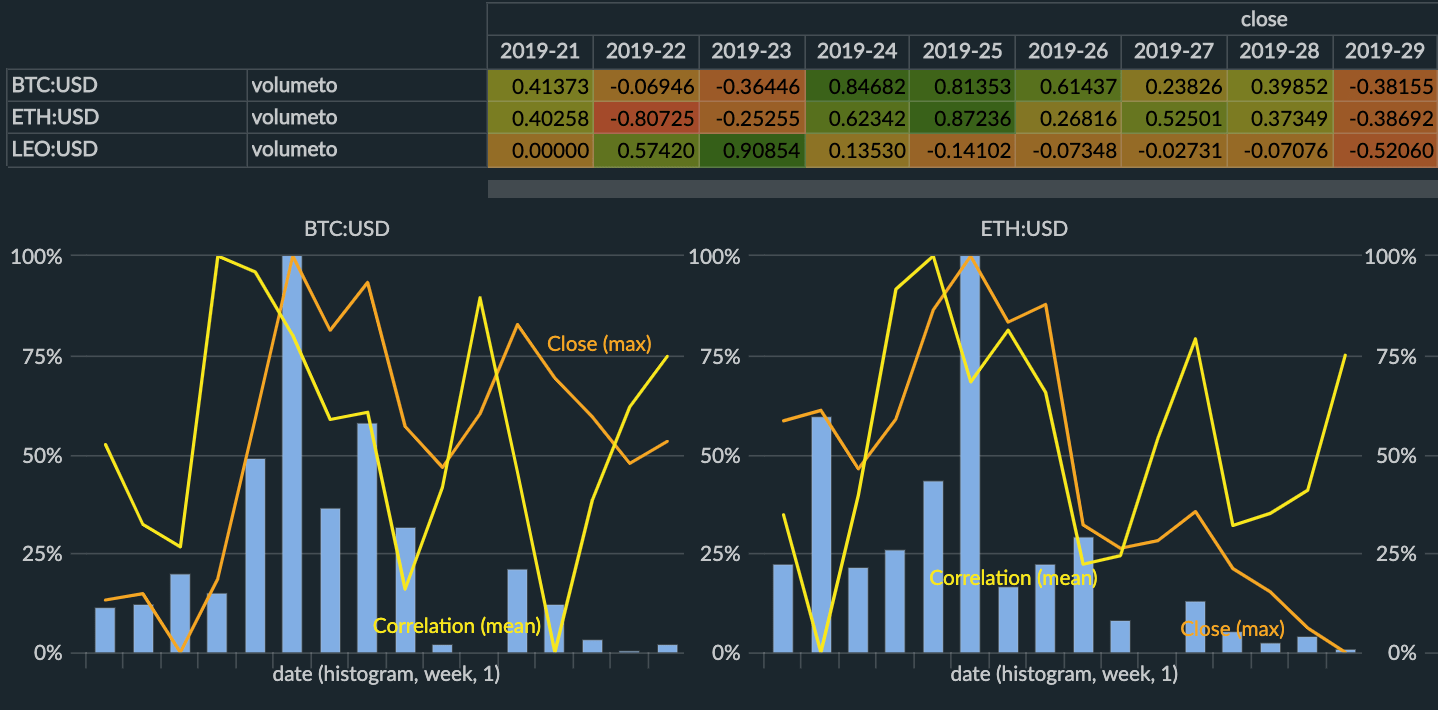
Here is embedded a dashboard to analyse correlation (calculated week by week) between trading volume and crypto price for Bitcoin, Ethereum and Leo.
At the top a simple pivot view shows all the evaluated weekly correlations for each cryptocurrency, coloured by range and sortable.
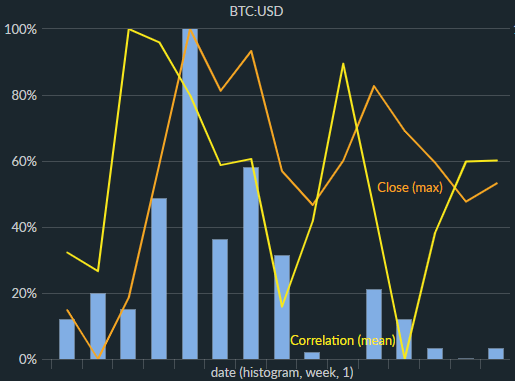
The bar / line charts show the average Volume as bars, the close average price and the correlation average in that split interval.
Finally filters on the right allow you to drill down and explore data over time.
BitFinex study
No Description
Needless to say… we haven’t found a pattern which can predict price movement with absolute certainty… but we are looking into it, for instance we tried to predict the Bitcoin price for the next few months by doing Time series forecast using Holt-Winters method. Here’s the results:
Bitcoin Forecast Holt-Winters
No Description
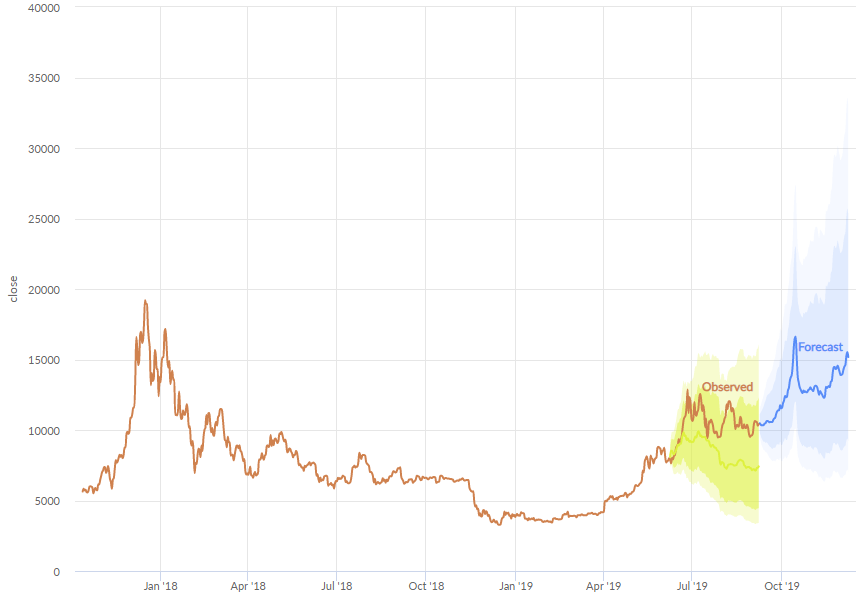
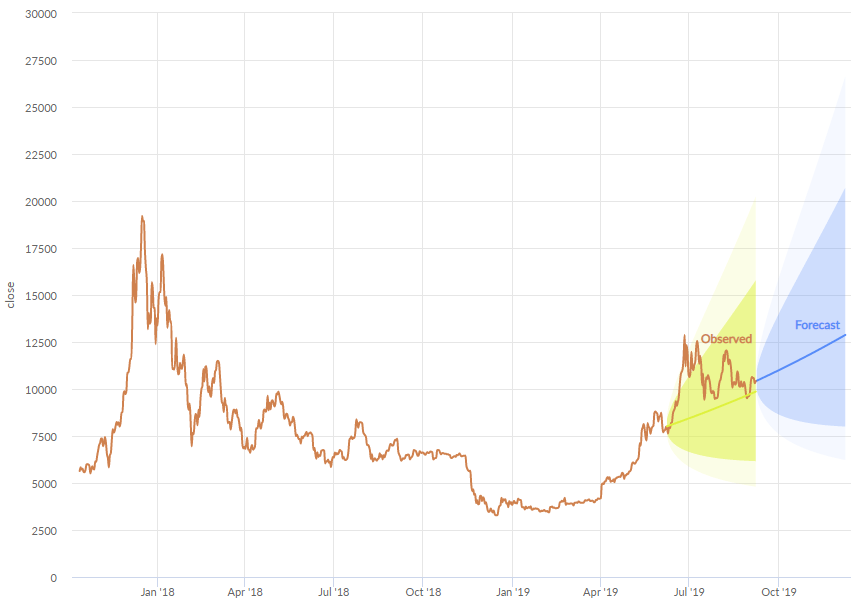
And here using ARIMA model to forecast Bitcoin future value:
Bitcoin Forecast ARIMA
No Description
If you are curious to see how we implemented the data workflow and the dashboards you can check the project here : Prices trend
We will refresh the data from time to time to keep the experiment live.
Comments are always welcomed.
No Comments